Section 8, HUD & Fair Market Rent Data
National Housing Choice Voucher, HUD Fair Market Rent, and rent-burden intelligence - organized by ZIP code so landlords and investors can price voucher-eligible units and find the markets where subsidized-tenant demand runs deepest.
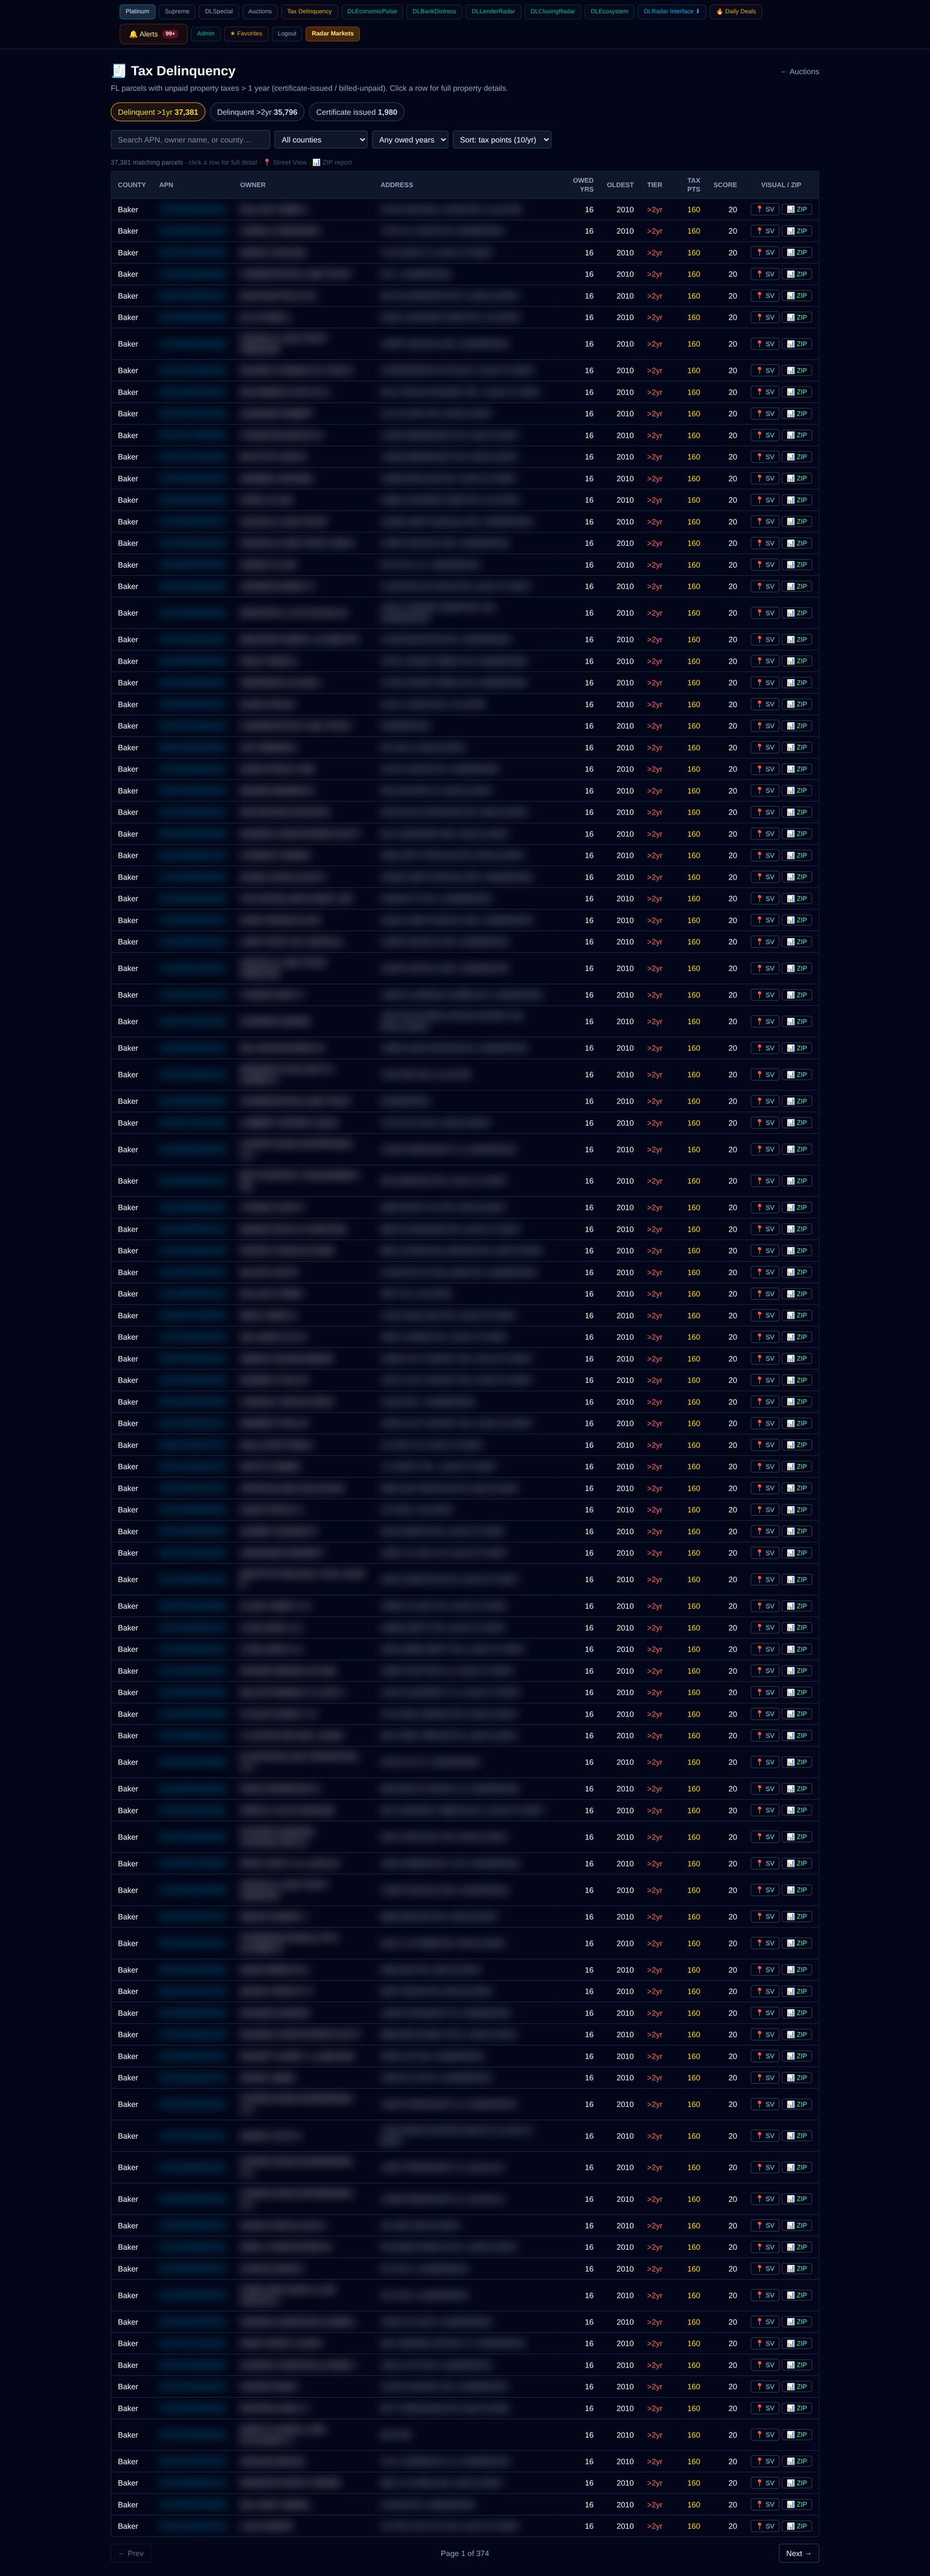
Actual DLRadar results · record-level detail unlocks with a plan
Section 8 - the Housing Choice Voucher (HCV) program - is the backbone of subsidized rental housing in the United States, and HUD's Fair Market Rent (FMR) tables set the rent ceiling that governs how much every voucher will pay in every ZIP. DLRadar joins HUD's published FMRs and voucher counts to Census rent and tenure data at the ZIP level, so instead of reading national averages you can see exactly where FMRs are high, where voucher density is thick, and where renters are most rent-burdened. That is the difference between guessing at a subsidized-rental strategy and underwriting one.
HUD Fair Market Rent by bedroom (national average)
Average FMR across 29,238 ZIP codes with a published Fair Market Rent. FMR is the HUD rent ceiling a voucher will pay for each unit size.
| Unit size | Avg Fair Market Rent (/mo) |
|---|---|
| Studio / 0-bedroom | $962 |
| 1-bedroom | $1,039 |
| 2-bedroom | $1,266 |
| 3-bedroom | $1,637 |
| 4-bedroom | $1,874 |
Voucher density & rent-burden signals
What FMR, HCV, and rent burden mean for landlords & investors
Fair Market Rent is your revenue ceiling on a voucher lease. When a ZIP's FMR sits above the market rent you could otherwise charge an unsubsidized tenant, accepting a voucher can raise - not lower - your effective rent, while HUD pays a large share directly and on time. When FMR sits below market, the voucher becomes a discount you may not want to give. Knowing the per-ZIP FMR by bedroom is how you tell those two situations apart before you buy.
Voucher density measures how many subsidized tenants are looking for units in a ZIP relative to its housing stock. High density means a deep, government-backed pool of demand that keeps occupancy up even in a downturn - the reason many buy-and-hold investors deliberately target Section 8-heavy ZIPs.
Rent burden is the early-warning gauge. ZIPs where a large share of renters already spend 30% or 50%-plus of income on rent are markets where affordability has run out, voucher demand is strongest, and turnover, delinquency, and eviction risk are elevated. Reading FMR, voucher density, and rent burden together tells you whether a ZIP is a durable subsidized-rental play or a fragile one.
Methodology
DLRadar builds its Section 8 layer from HUD's published Fair Market Rents (studio through 4-bedroom), HUD Housing Choice Voucher counts, FHA loan concentration, and the U.S. Census American Community Survey (ACS) for rent, tenure, and rent-burden shares. Each source is joined to ZIP Code Tabulation Areas (ZCTAs) and rolled into a per-ZIP HUD distress score (0-100) alongside the raw FMR, voucher-density, and rent-burden metrics. The national figures on this page are aggregates across the covered ZIP universe and are refreshed on a rolling schedule; open any ZIP Stress Report for the underlying ZIP-level detail.
Go from national averages to a single ZIP
This page is the free national view. Open the FMR, voucher-density, and rent-burden numbers for any ZIP in its Stress Report - or create a free account to track the markets you invest in.
Related: ZIP Stress Report · Distressed ZIP codes · Distress map
Section 8 & Fair Market Rent FAQ
What is Fair Market Rent (FMR) and why does it matter?
Fair Market Rent is HUD's annual estimate of the rent - including utilities - needed to lease a modest, safe unit in a given area, set at roughly the 40th percentile of local rents. FMR is the ceiling that determines how much a Housing Choice Voucher (Section 8) will pay in each ZIP. For landlords and investors it is the single most important number for pricing a voucher-eligible unit, because it caps the subsidized rent you can collect on a leased property.
What is a Housing Choice Voucher (Section 8)?
The Housing Choice Voucher program - commonly called Section 8 - is HUD's largest rental-assistance program. A local housing authority pays part of the tenant's rent directly to the landlord, up to the area's payment standard (based on FMR). Voucher density - the number of active vouchers per 1,000 housing units - tells you how deep the subsidized-tenant demand runs in a ZIP, which is a durable, recession-resistant source of rent for buy-and-hold investors.
What does rent burden tell an investor?
Rent burden is the share of renter households spending 30% or more (and, more severely, 50% or more) of income on rent. High rent burden signals a market where tenants are stretched, turnover and eviction risk climb, and voucher demand is strongest. DLRadar tracks rent-burden rates from Census ACS at the ZIP level so you can separate stable rental markets from fragile ones.
Where does DLRadar's Section 8 and FMR data come from?
We combine HUD's published Fair Market Rents, HUD Housing Choice Voucher counts, FHA loan concentration, and Census American Community Survey (ACS) rent and tenure data, joined to ZIP Code Tabulation Areas. The result is a per-ZIP HUD distress score plus the FMR, voucher-density, and rent-burden metrics summarized on this page and detailed in each ZIP Stress Report.